Eye Tracking, What It Is And How It Is Applied In Web Marketing
Eye tracking and heat maps are two methods used by Neuromarketing to track user behavior when they visit a website.
Eye tracking is a process that monitors eye movements to determine where a subject is looking at any given moment. It is a scientific methodology that helps to understand the intuitions of the human mind.
The eyes allow us to explore, learn and gather information from the surrounding reality, thus influencing our decisions and actions. For this reason, measuring visual attention objectively through eye-tracking techniques allows us to study human behavior.
The first studies on eye movement tracking date back to the late nineteenth century, but during the twentieth century, they specifically concern the medical and academic fields. However, starting from the new millennium, they also affect the world of entrepreneurship and marketing, making it a fundamental tool for analyzing purchasing behavior.
In 2006, a Dutch researcher, Jakob Nielsen, published a study showing how users surf the Internet is somewhat predictable and ordinary.
His survey was based on the behavior of 232 users in front of websites of different natures, discovering that everyone interacted in the same way.
In particular, Nielsen noticed the speed with which users assimilated information from web pages and left them after a few seconds. Furthermore, he noticed that their gaze seemed to draw a sort of letter “F” on the screen, moving horizontally and then rapidly descending vertically.
Table of Contents
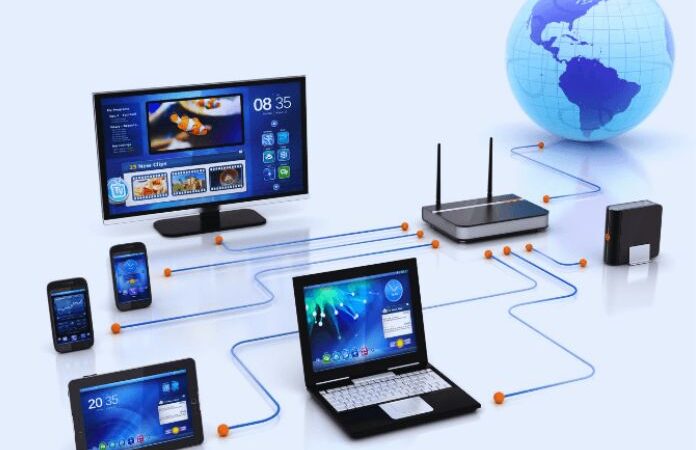
How Eye Tracking Works
Eye movements are tracked using specific devices called eye trackers, while data processing is entrusted to special software that can use different techniques.
The most used technique is the PCCR, or the corneal reflection of the center of the pupil. This method uses a light source to illuminate the eye, thus causing evident reflections that are highlighted both in the pupil and the cornea and photographed by an infrared camera.
Subsequently, the vector is calculated, consisting of the angle between the two reflections on the different parts of the eye. The direction of the vector determines, in turn, that of the gaze.
Infrared light is used for this measurement, as it distinguishes the pupil from the cornea. Also, not being visible to humans cannot cause distraction during eye monitoring.
Also Read : Data Analysis
The Eye Tracker
The eye tracker looks like a pair of portable glasses equipped with infrared and high-definition cameras that can record where the gaze is placed. There are different types of this device.
Screen-based eye trackers, also known as desktop, remote, or stationary, are standalone devices that connect to a laptop or monitor. Wearables include both glasses and virtual reality headsets. Webcam eye trackers work through a camera connected to a computer, supported by specific software.
The Heat Maps
Heat maps are graphical representations derived from eye tracking that help website owners understand what users see when they access their domain.
Conceived in the 90s and underestimated for a long time, they are essential for measuring a site’s usability and analyzing the elements that can attract attention.
Information is not revealed through numbers but through colors. Warmer colors like yellow, red, and orange indicate more activity on the page, while more excellent colors like green, blue, and blue indicate parts with less activity on the page. Part of the users.
Heat maps come in three varieties. Scroll maps allow you to understand how the user scrolls the page and what precisely displays it. They are used primarily for landing pages where the contents are extended and developed vertically, to optimize Call To Action to understand if it is necessary to insert new ones in strategic positions, and finally, to evaluate the effectiveness of a page.
Click maps are helpful for understanding which buttons or links users click on most frequently and whether some are more powerful than others. Some Call To Action may perform more than others, depending on the text they contain, the colors used, and their position on the page.
Hover maps analyze where the visitor moves the mouse within the page. Often the mouse follows the movement of the user’s eye, but this is only sometimes the case.
The Best Heatmap Software
Once you have clarified what heat maps are and their function, you need to know which tools track the behavior of the public on a web page, collect the data and return the graphic result.
- Crazyegg is considered one of the best professional tools. In addition to detecting audience interest through heatmaps, you can create A/B tests and detailed traffic analyses.
- Hotjar is the perfect tool to do a complete job, as it gives the possibility to record user sessions to understand better how they behave both from mobile and desktop.
- Microsoft Clarity creates heat maps using open-source and GDPR-compliant software. This free tool allows all data to be recorded and analyzed without limits.